Sample editor
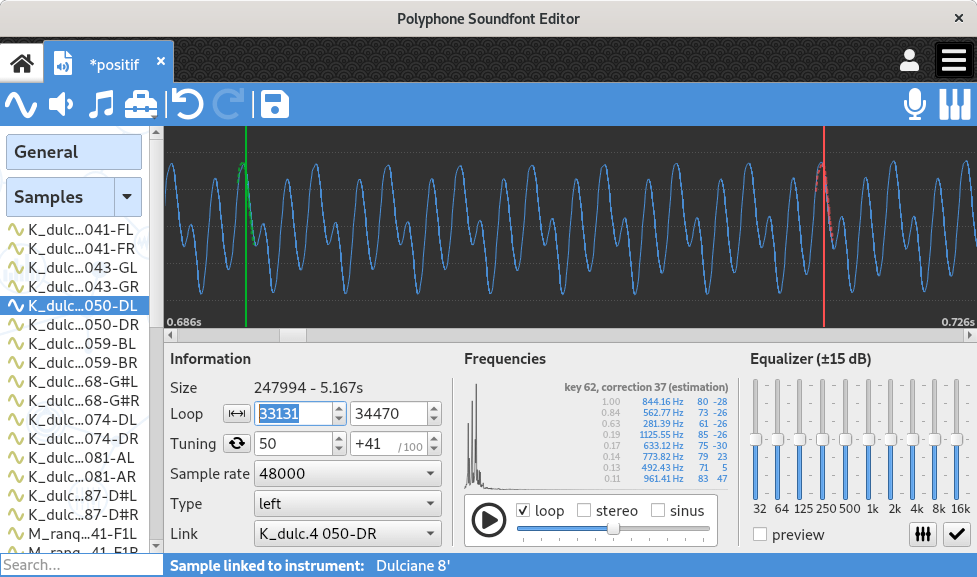
When clicking on one or more sample(s) in the tree, the editing page of the samples appears.
This page is divided into several parts:
- a graph representing the sample,
- an information area,
- an analyze of frequencies,
- an equalizer,
- a sample player.

The graph
Zoom & drag
The graph allows the visualization of the sound wave. It is possible to zoom vertically or horizontally by holding a right mouse click and dragging:
- dragging right expands the horizontal axis,
- dragging left contracts the horizontal axis,
- dragging up expands the vertical axis,
- dragging down contracts the vertical axis.
Holding the left mouse button allows a horizontal move of the graph, if the horizontal axis has been expanded.
Loop and playing positions
A green vertical bar indicates the start position of the loop (changeable by left click), a red bar indicates the position of the end of the loop (changeable by right click). A dotted line representing a wave portion is associated with each vertical bar, useful for visualizing the superimposition of the beginning and the end of the loop.
During playback, a white vertical bar runs across the graph and indicates the playback position in real time.
Cutting the sample
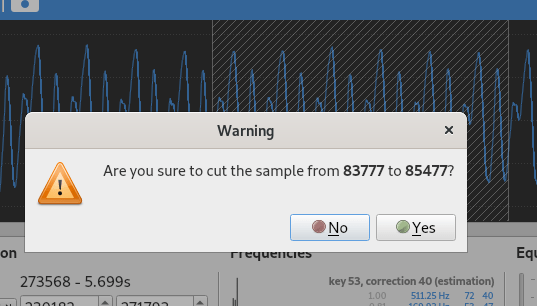
When holding the Alt keyboard button, it is possible to define an area to cut:
- a left mouse button press defines the start of the area,
- the corresponding left mouse button release defines the end of the area.
Once an area is defined, a dialog appears to ask for a confirmation before cutting the sample.

Colors of the graph
Graph colors are editable in the software preferences.
Section “Information”
The section “Information” allows the editing of the following information:
- start and end of the loop,
- root key of the sample and its correction to be applied for the sound to be tuned in the equal temperament,
- sound sample rate (a change will cause re-sampling),
- sound type (not linked: mono, otherwise left, right or linked),
- the linked sample if the sample is stereo.
In addition, the sample size in samples (number of values) and seconds is shown.
A button edits the start and end of the loop so that the loop is the entire sample. Another button edits the root key and the correction so that they match with the evaluation of the frequency.
Any change on a stereo sample may be applied on the linked sample if the option Stereo editing is ticked in the preferences. Via a multiple selection in the tree, several samples may be edited simultaneously.
Frequency analysis
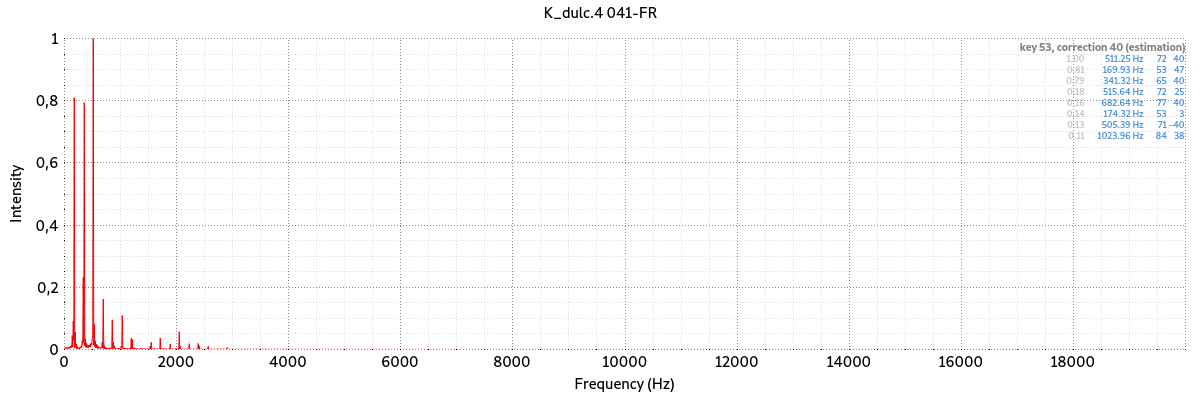
The frequency analysis includes a Fourier transform (graph showing the intensity of frequencies contained in the signal).

On the right is shown the list of dominant peaks with the following information:
- ratio between the peak intensity and the intensity of the maximum peak,
- frequency,
- closest corresponding key,
- correction (distance to the closest corresponding key).
From these data an estimate of the pitch of the sound is made. This estimate can be used for tuning.
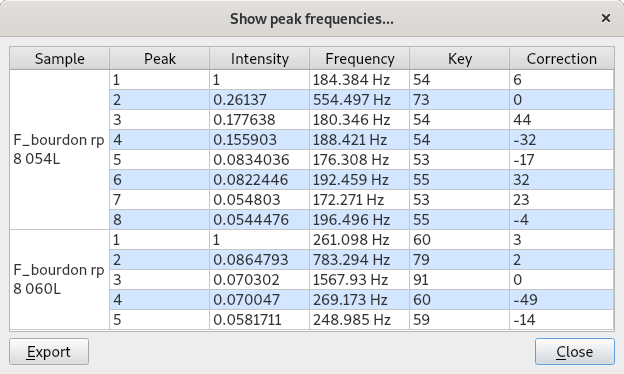
A right click on the graph opens a contextual menu that allows you to:
- export the graph into a .png image,
- show the list of all peaks and a button for exporting this list into a .csv file.

Equalizer
The equalizer makes it possible to increase or decrease some frequencies, from -15 to 15 dB. It is possible to listen to the effect with the option preview enabled and then definitely apply the effect by pressing the Apply button. Pressing reset resets all the buttons to 0 dB (but does not remove the effect on the sound: for that use the undo button in the toolbar).
Any change on a stereo sample may be automatically applied on the linked sample if the option is checked in the preferences.
Player
The player plays the sound. During playback, a white cursor runs across the graph to indicate the playback position. Playback options are:
- Loop
- Plays the sound loop if the beginning and end of the loop are completed.
- Stereo
- Plays the sample in stereo, with its linked sample. If looping is also required, the two respective loops are used (they can be different).
- Sine
- A sine calibration signal is added to the sound, allowing a sample tuning to the nearest pitch hundredth. At first the root key must be filled. At this level, beats can be heard if the frequency of the sine differs slightly from the fundamental frequency of the sound. It remains to finely adjust the correction to make the beats as slow as possible, so that the sample is tuned at best. See the tutorial “How to prepare a sample” for more information.
If a playback is in progress when switching from one sample to another through the tree, it automatically restarts. Also, pressing the key space enables or disables playback if you are navigating in the tree.
Polyphone is free but there are costs associated with its website and development. A small donation will help a lot.
Donatetop